It is that time of the year again! Taxes! New TFSA Contribution room! RRSP Deadline! This will inevitably spur the discussion of Federal Government’s “Gold Plated” Defined Pension Plan and how it’s anchored basically by tax payer money.

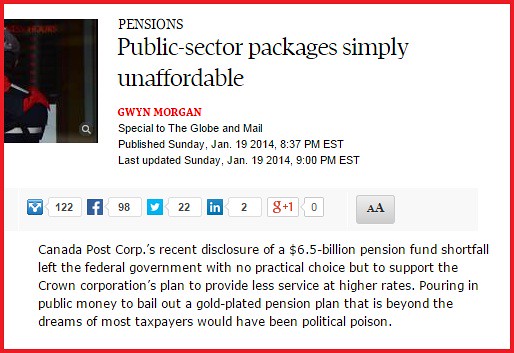
Globe and Mail reported that the public sector pension is simply unaffordable. Is it really that awesome and amazing? Let’s see!
For this exercise, I will use the Canadian Federal Government’s Public Service Pension as a reference guide.
Hypothetical Joe is a 30 year old who just joined the workforce as a public servant earning $50,000 a year. We will walk through the benefits and opportunity costs for being in the pension plan he is entitled to each year.
Contribution Calculations

According to the Treasury Board of Canada, he is required to contribute 7.05% and 8.54% of his earnings into the plan depending on the CPP AMPE number*.
*That number is currently sitting at roughly $53,000
What this means is if someone was making $60,000 per year, the $53,000 would be at 7.05% and the remaining $7,000 would be at 8.54%.
$53,000 x 0.0705 = $3736
$7,000 x 0.0854 = $598
He would have to top up $4334 each year.
In our scenario, Hypothetical Joe on his first employment year would pay:
$50,000 x 0.0705 = $3525
So on a $50,000 a year salary, he is topping up $3525 per year.
Payout Calculations
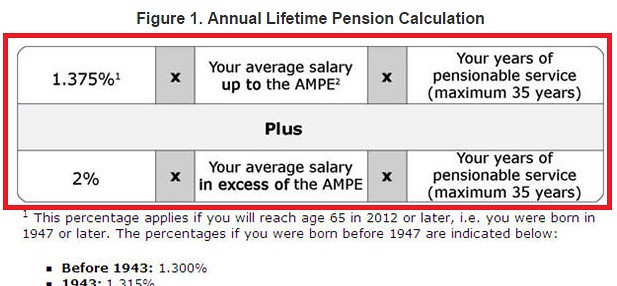
According to the Treasury Board, your payout at age 65 is the following formula:

*The AMPE (Average Maximum Pensionable Earnings) number is currently sitting at $53,000
What is means is that payout takes into consideration of your top 5 salary years and averages them out. If someone worked for 6 years and earned $50,000, $52,000, $54,080, $56,243, $58,492, and $60,832, then his 5-year best would be the last 5 years averaged out, which is $56,329.75
His pension payout would be calculated as:
= 0.01375 x $53,000 x 6 years worked
+
= 0.02 x $3,329 x 6 years worked
= $4372.5 + $399.5
= $4772
When, after 6 years of employment, Joe retires at age 65, he would be entitled to a pay of $4772 per year.
Pension is really just an insurance with built in annuity payments
You pay a set amount of your pay stub today for constant payments sometime in the future.
Thus, the question becomes, would you be willing to put in X amount today and receive annual payments of Y per year after you hit 65?
What if you, the savvy investor, instead invested that X amount at all stock portfolio giving 7.5% rate of return over the course of 35 years?
I’ve included a spreadsheet for a hypothetical scenario: You start in the government at age 30 at $50,000 per year salary and it grows by 4% per year. Pay attention to the last 3 columns.
Age | Salary (4%+ per year) | Annual Pension Contribution | Total Value at 65 | Annual Pension at 65 | Ratio |
|---|---|---|---|---|---|
| 30 | $50,000.00 | $3,525.00 | $44,305.27 | $687.50 | 64.44 |
| 31 | $52,000.00 | $3,666.00 | $87,168.04 | $701.25 | 124.30 |
| 32 | $54,080.00 | $3,828.73 | $128,810.30 | $715.37 | 180.06 |
| 33 | $56,243.20 | $4,013.47 | $169,416.35 | $2,921.46 | 57.99 |
| 34 | $58,492.93 | $4,205.60 | $208,997.64 | $3,760.07 | 55.58 |
| 35 | $60,832.65 | $4,405.41 | $247,566.79 | $4,772.07 | 51.88 |
| 36 | $63,265.95 | $4,613.21 | $285,137.46 | $5,882.86 | 48.47 |
| 37 | $65,796.59 | $4,829.33 | $321,724.20 | $7,098.20 | 45.32 |
| 38 | $68,428.45 | $5,054.09 | $357,342.36 | $8,424.15 | 42.42 |
| 39 | $71,165.59 | $5,287.84 | $392,007.95 | $9,867.07 | 39.73 |
| 40 | $74,012.21 | $5,530.94 | $425,737.52 | $11,433.68 | 37.24 |
| 41 | $76,972.70 | $5,783.77 | $458,548.11 | $13,131.03 | 34.92 |
| 42 | $80,051.61 | $6,046.71 | $490,457.14 | $14,966.54 | 32.77 |
| 43 | $83,253.68 | $6,320.16 | $521,482.34 | $16,948.02 | 30.77 |
| 44 | $86,583.82 | $6,604.56 | $551,641.66 | $19,083.69 | 28.91 |
| 45 | $90,047.18 | $6,900.33 | $580,953.23 | $21,382.18 | 27.17 |
| 46 | $93,649.06 | $7,207.93 | $609,435.29 | $23,852.55 | 25.55 |
| 47 | $97,395.02 | $7,527.84 | $637,106.13 | $26,504.37 | 24.04 |
| 48 | $101,290.83 | $7,860.54 | $663,984.08 | $29,347.66 | 22.62 |
| 49 | $105,342.46 | $8,206.55 | $690,087.40 | $32,392.96 | 21.30 |
| 50 | $109,556.16 | $8,566.40 | $715,434.32 | $35,651.37 | 20.07 |
| 51 | $113,938.40 | $8,940.64 | $740,042.93 | $39,134.51 | 18.91 |
| 52 | $118,495.94 | $9,329.85 | $763,931.21 | $42,854.64 | 17.83 |
| 53 | $123,235.78 | $9,734.64 | $787,116.96 | $46,824.60 | 16.81 |
| 54 | $128,165.21 | $10,155.61 | $809,617.82 | $51,057.90 | 15.86 |
| 55 | $133,291.82 | $10,593.42 | $831,451.20 | $55,568.72 | 14.96 |
| 56 | $138,623.49 | $11,048.75 | $852,634.28 | $60,371.97 | 14.12 |
| 57 | $144,168.43 | $11,522.28 | $873,184.02 | $65,483.29 | 13.33 |
| 58 | $149,935.17 | $12,014.76 | $893,117.10 | $70,919.11 | 12.59 |
| 59 | $155,932.57 | $12,526.94 | $912,449.95 | $76,696.68 | 11.90 |
| 60 | $162,169.88 | $13,059.61 | $931,198.70 | $82,834.11 | 11.24 |
| 61 | $168,656.67 | $13,613.58 | $949,379.22 | $89,350.43 | 10.63 |
| 62 | $175,402.94 | $14,189.71 | $967,007.05 | $96,265.58 | 10.05 |
| 63 | $182,419.05 | $14,788.89 | $984,097.46 | $103,600.53 | 9.50 |
| 64 | $189,715.82 | $15,412.03 | $1,000,665.39 | $111,377.26 | 8.98 |
Total Value at 65: Refers to the total value of your pension contributions had you invested at a low cost index fund giving a 7.5% rate of return.
Total Payout: Refers to the amount your pension would pay you out.
Ratio: It is ratio of your total value vs annual pension payout. The large number in the early years basically means it’s really terrible early on but gets better as the years progress.
At the end of the chart, you would be 65 with a salary of $189,xxx before you retire. Your pension would be worth $111,xxx per year. However, had you invested all your contributions at an index fund, it would have been worth over a million!
Conclusions
Public Service Pensions are absolutely terrible early on but gets better with time.
This is reflected by the high ratio numbers during the early years and slowly going down.
It only starts to get decent after year 25
That is when the ratio is around 15 to 1 aka 6.6%.
Worst Case Scenario: You joined the Federal Service Pension at a very young age and quit after 2 years of working there.
If Hypothetical Joe worked for 2 years earning $50,000 and $52,000 and then subsequently quit for another position in a private company, he would have paid over $7000 but entitled to just mere $701 annuity payments when he is 65. At such a young age, his pension contributed would have grown to a massive $87,000 had he invested that amount!
Best Case Scenario #1: You join the Federal Service Pension at age 62/63 with a high starting salary and quit after 2 years of working there.
Using the above scenario, imagine that Hypothetical Joe is now 62 and managed to snag a job in the Federal government. In his short 2 years, he would put up $7000 and start receiving annuity payments of $700 right away!
That’s a 10% guaranteed return until his death!
Best Case Scenario #2: You work the full 35 years
You would be entitled to a pension that pays 1/9 of what you would have made investing in the stock market.
Wouldnt it better just have fun in life? I’d rather prefer to have fun parties or travelling in young age, instead of waiting for 65. Besides that, you might not even survive to that age.
I feel it’s kinda stupid when you go to pension they pay small amount over many years. Why they just dont give everything? That would be more fair. Most people wont even get all money back they invested because they would not surive. I’d rather have 20.000$ “now”, than in “far far future”.
And besides that, all money you waste on pension is the money you’re not going to invest into business. Business can get you a lot more money (ofc it will require skill; it takes no skill put money into pension)
For me pension always sounded like scam.
Absolutely I believe you should have a healthy balance of having fun today and saving for the future!